Manager Manual
Reporting, Screens, And Oversight In One Place
Built for managers, chefs, and leaders who need visibility into kitchen activity, reporting, and live screen status across the club.
Logging In
MyODS uses a single sign-on system. These logins are provided by TTA and can only be used on 1 computer at a time. If you have trouble logging in reach out to help@tta.club or call 813-249-0303 for help.
Manager Login For Reports And Backend Access
Use this flow from your PC or phone when you need the backend and reporting tools.
Open the app from your PC or phone
Type your club's MyODS address into Chrome or Edge so you can reach the backend login page.
Enter your manager credentials
Use the manager account provided for backend access, then press Sign In.
Open reports or backend tools
After login, navigate to the reporting or backend area you need. If you are unsure which account to use, contact TTA support.
Locked out?
If you see "Access Denied" after logging in, your account may not have the correct role assigned. Reach out to TTA at help@tta.club or call 813-249-0303 to check your permissions.
Dashboard
This is what managers see after logging in. The dashboard gives a 30 day snapshot of the club's activity, and the filter near the top lets you narrow the data to a specific sublocation, such as an individual restaurant.
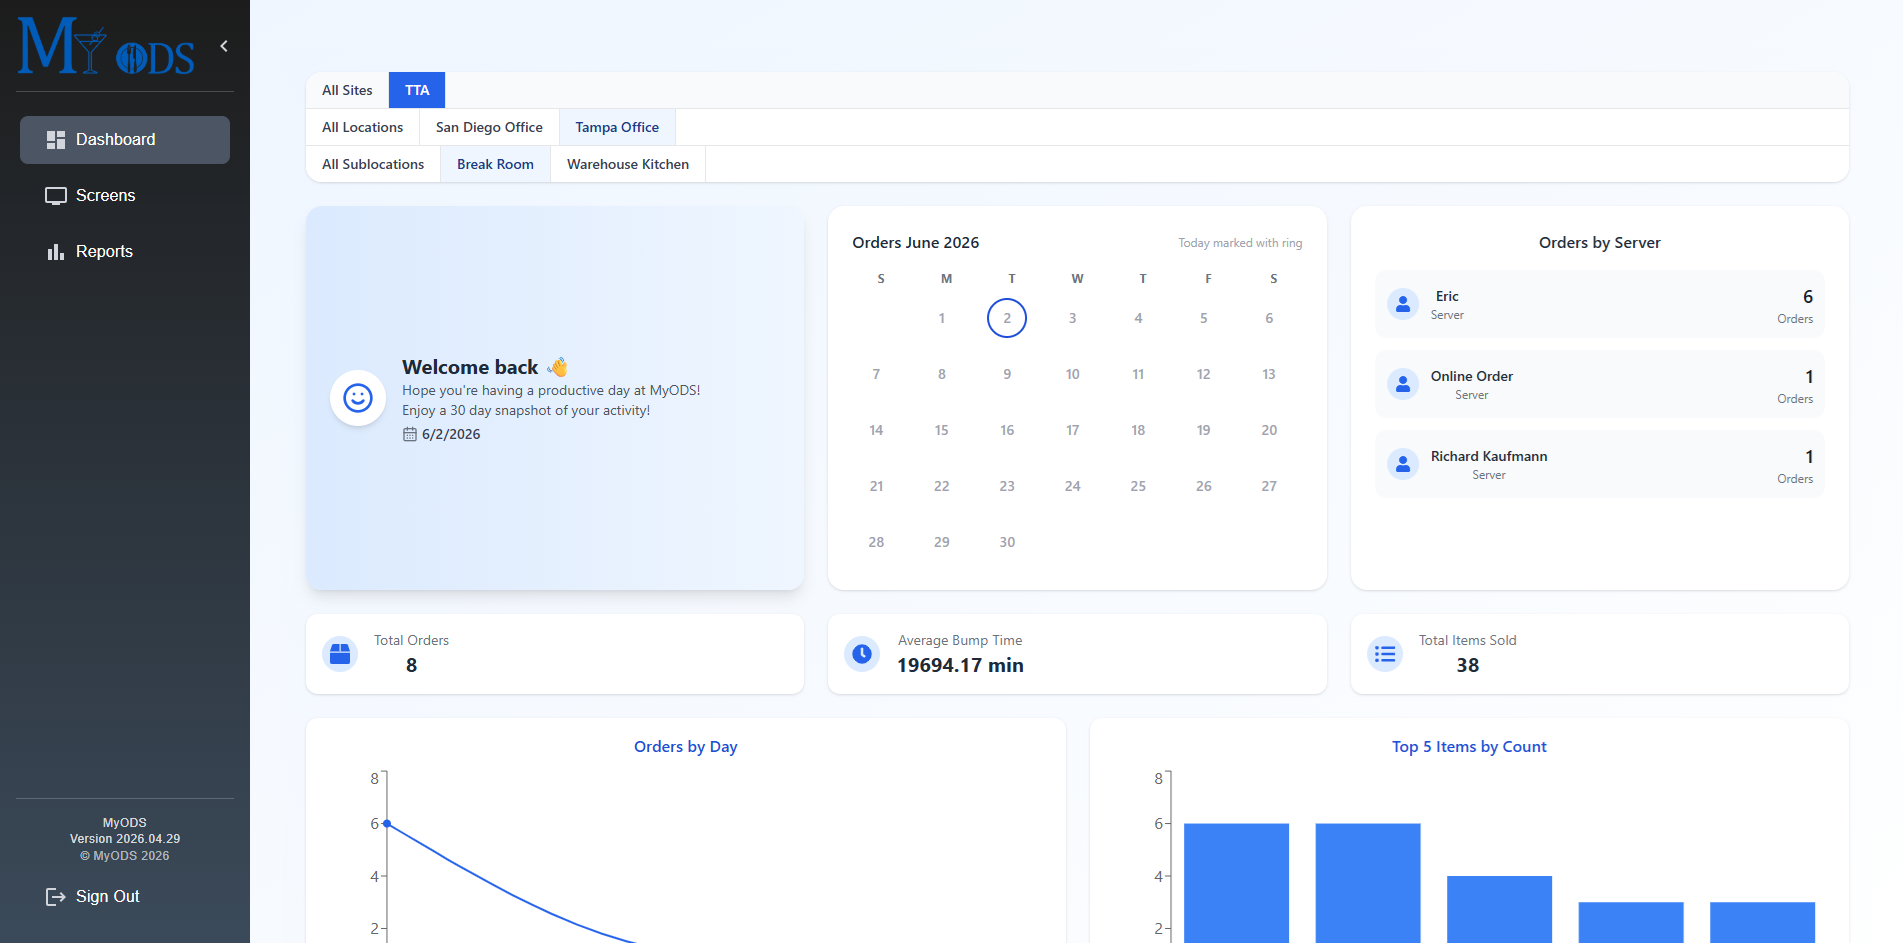
30 Day Snapshot
The dashboard is meant to give managers a quick 30 day snapshot of club activity. It surfaces recent order volume, timing, item activity, and other high level trends at a glance.
Site And Sublocation Filter
Near the top of the dashboard there is a filter that lets you narrow the data down to a specific sublocation, also referred to as a restaurant. This helps managers focus on one outlet instead of the full club view.
Summary Tiles And Charts
The rest of the dashboard is made up of summary cards and charts that help managers quickly understand recent performance. Use it as a starting point before drilling into the reporting screens for more detail.
Screens Tab
The Screens tab lets managers peek into the kitchen screens and see what the team is looking at in real time. This is also a great place to understand how MyODS organizes stations by site, location, and sublocation.
Important warning
Actions taken from this page can affect the live kitchen screens too. Be careful when interacting with tickets or screen controls here during service.
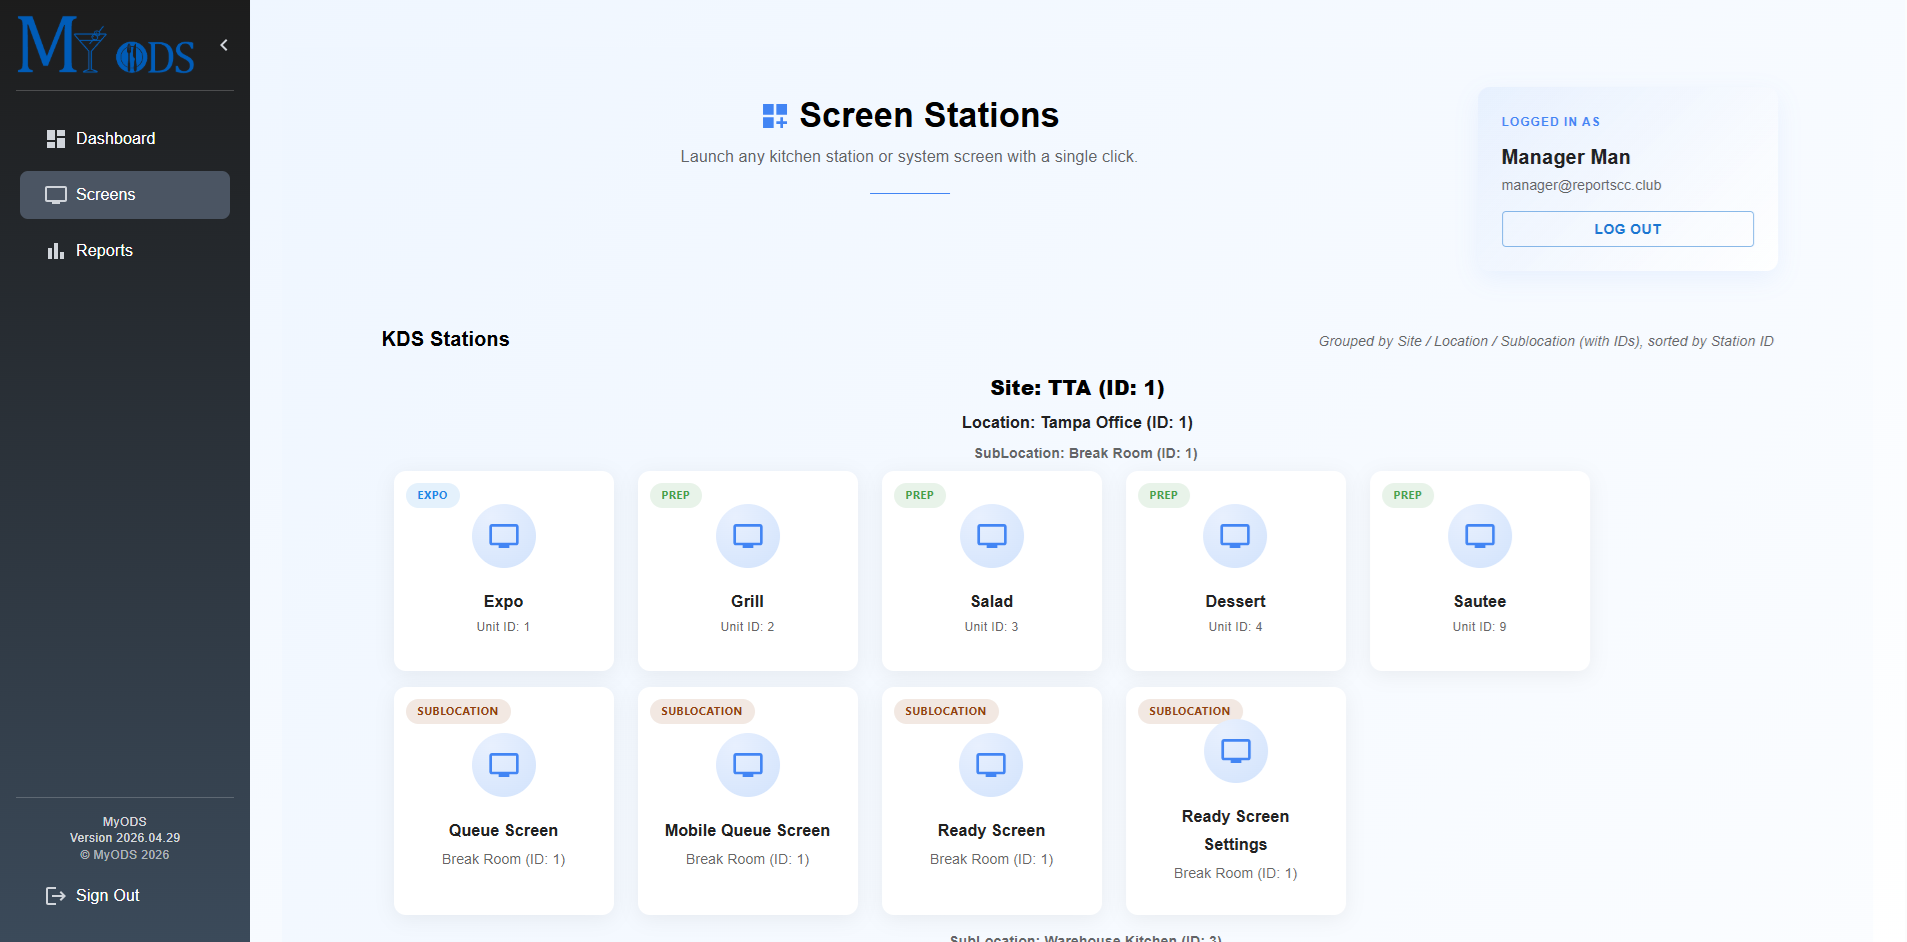
Peek Into Active Screens
This page gives managers visibility into the live kitchen displays without needing to stand at each station.
Site / Location / Sublocation Hierarchy
MyODS separates screens by site, location, and sublocation. A site is the broad top level group for an organization. A location is the physical property or club. A sublocation is the restaurant, outlet, or service area inside that club, such as Main Dining, Pool Bar, or a halfway house.
Most Clubs Will Only Have One Site
For 95% or more of clubs, there will only be one site in MyODS. Most of the separation managers care about day to day will happen at the location and sublocation level.
Live Screen Access
This tab is meant for visibility into the live boards the kitchen is using.
Grouped By Hierarchy
The page is grouped by site, location, and sublocation so managers can understand where each screen belongs in the overall club structure.
Restaurant Level Visibility
This is especially useful when a club has multiple dining outlets and managers need to look at one restaurant or service area at a time.
Reports
The Reports area is where managers and chefs turn kitchen activity into usable decisions. Use it to spot trends, understand speed of service, compare outlets, and answer practical questions about volume, menu mix, and workflow.
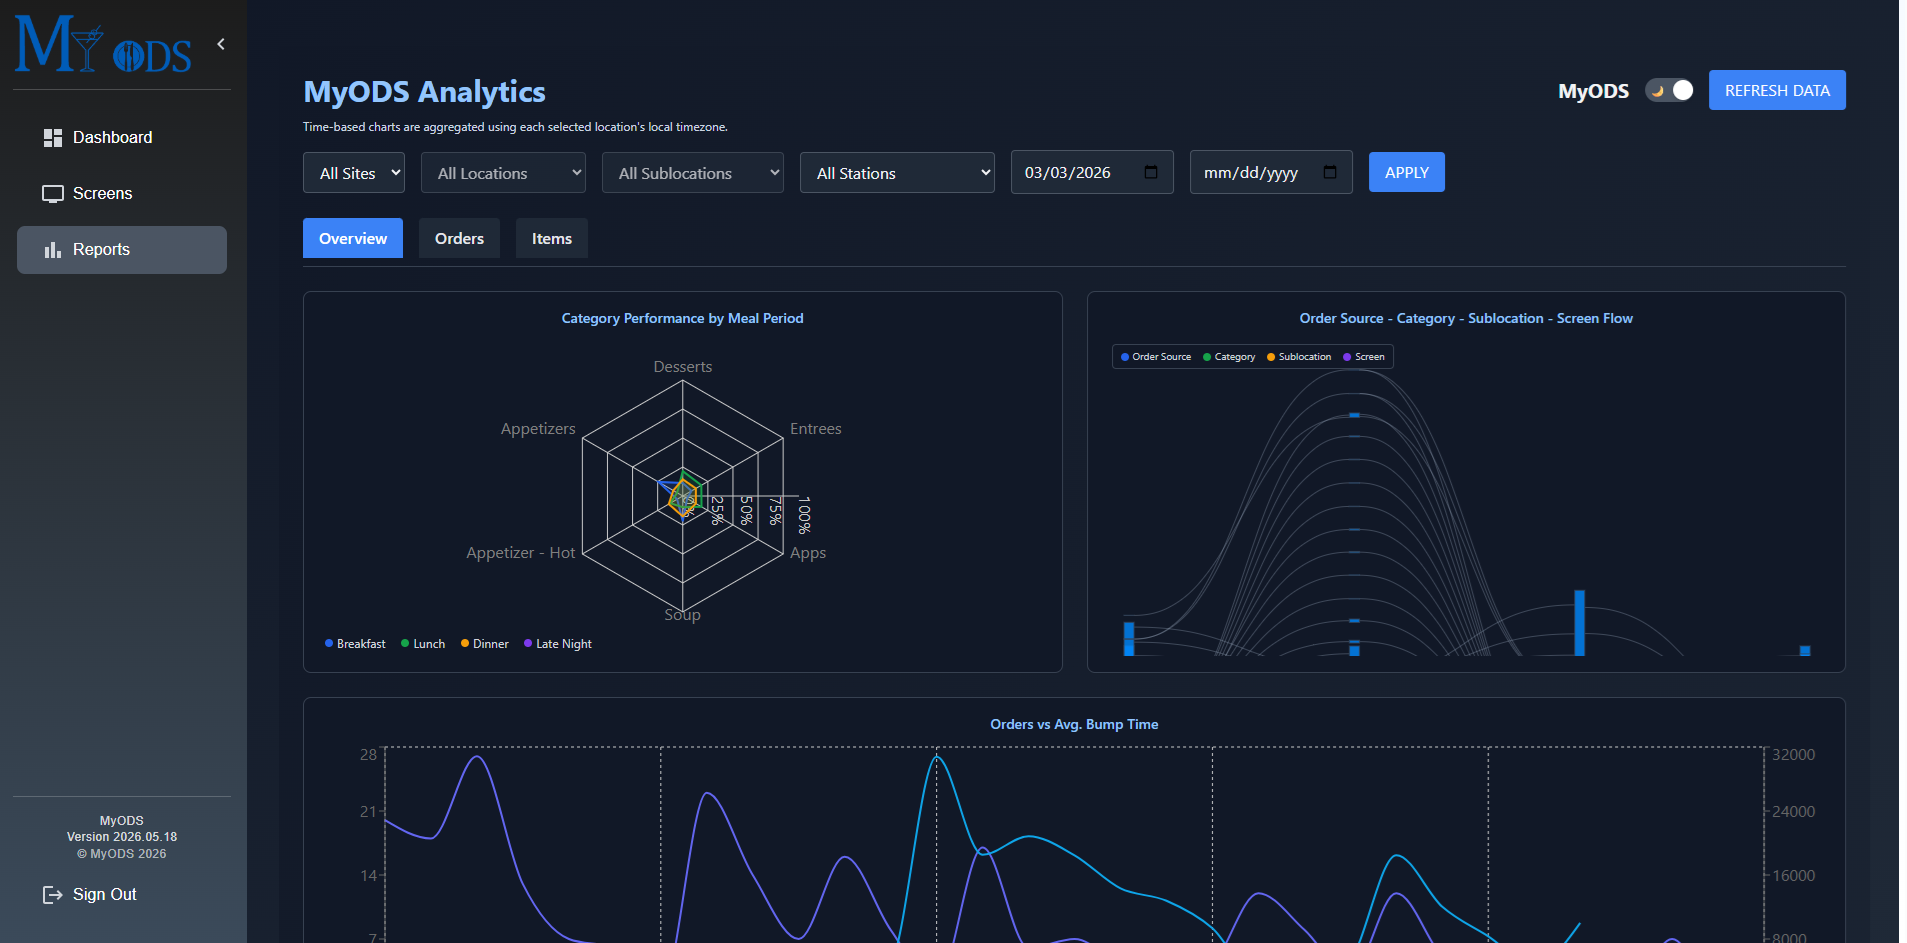
How To Read The Reports Page
1. Scope Filters
These filters let you choose the part of the organization you want to review. Most clubs will live at the location and sublocation level here.
2. Date Range
Use the date fields to define the reporting window. Short ranges are best for shift reviews. Longer ranges are better for trend spotting.
3. Report Tabs
The page is split into Overview, Orders, and Items. Think of these as three different ways to look at the same operational story.
4. Apply And Refresh
After changing filters, press Apply to reload the data. Refresh Data is useful when you want the latest numbers pulled into the page.
Overview
General trend view with deeper filters than the dashboard.
The Overview tab is a general overview similar to the dashboard, but with more filters so managers can compare trends against the exact part of the operation they want to review.
What It Is Good For
Quickly understanding volume, bump-time behavior, peak periods, and broad trends across the selected site, location, sublocation, station, and date range.
Manager Intent
Use this tab when you want to compare one period against another and understand whether trends change based on outlet, station, or time window.
Pro Tip
When average bump time jumps, do not assume the kitchen slowed down immediately. First compare that spike against total order volume and the heatmap so you can see whether it lines up with a genuine rush.
Overview Reports And Charts You Can Use
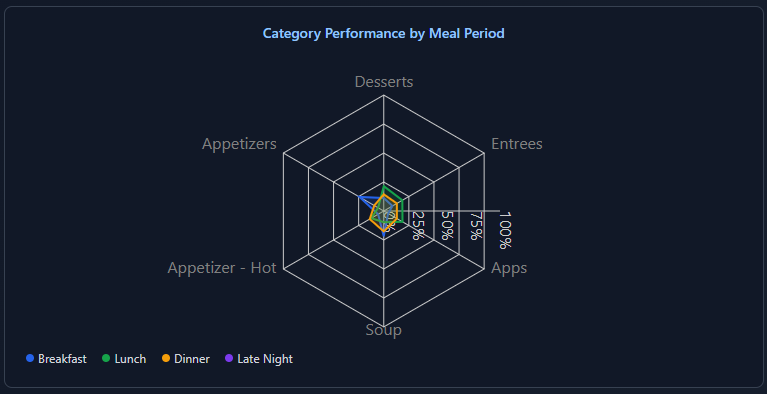
Category Performance by Meal Period Radar Chart
How to read
Read each spoke as a menu category and compare how far each meal period extends outward. The farther the line reaches on a category, the stronger that category performed during that meal period.
What it is intending to show
This chart is meant to show how menu mix changes by meal period so managers and chefs can quickly see whether breakfast, lunch, dinner, or late night behave differently.
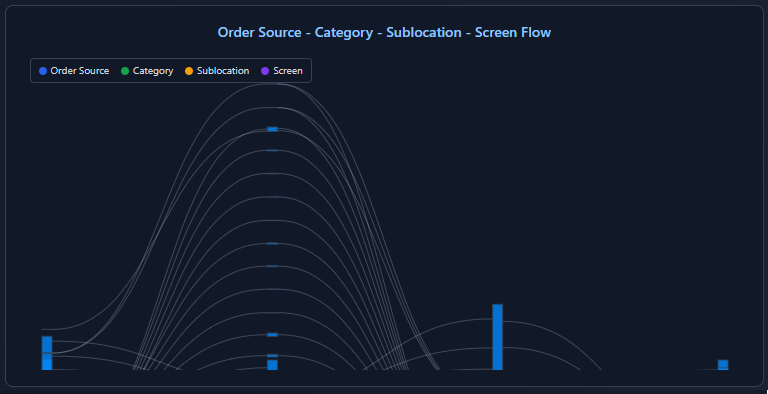
Order Source - Category - Sublocation - Screen Flow Sankey Chart
How to read
Follow the flow from left to right. Each connection shows how orders move from source to category to sublocation and finally to the screen destination.
What it is intending to show
This chart is meant to show how orders travel through the MyODS structure so managers can understand where volume is coming from and where it is ending up.
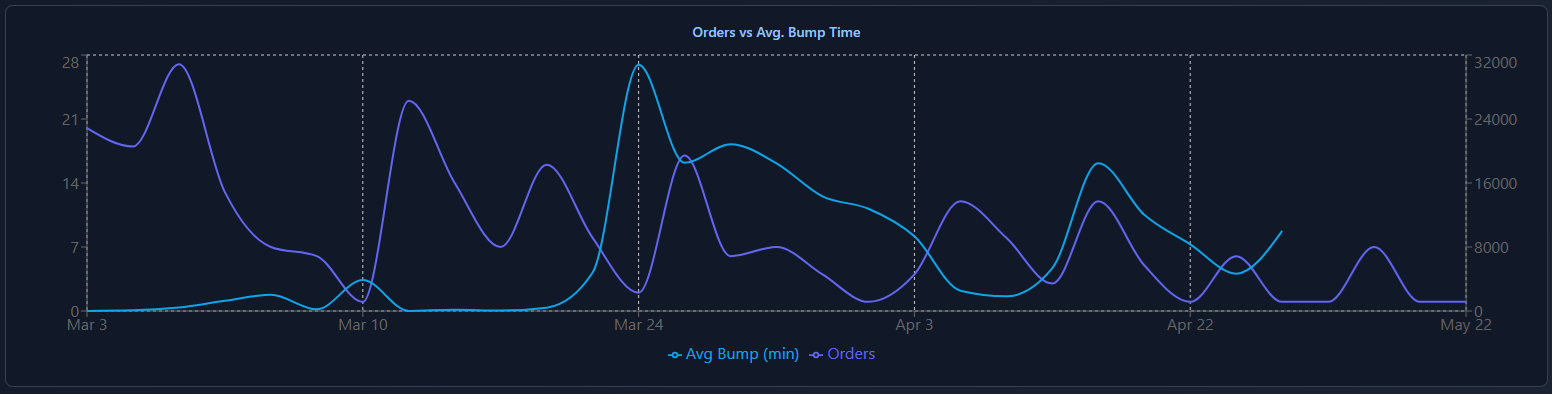
Orders vs Avg. Bump Time Dual Line Chart
How to read
Compare the two lines across the same dates. One line represents orders and the other represents average bump time, letting you see how they move together or apart.
What it is intending to show
This chart is meant to show whether service speed changes are lining up with volume changes or whether another operational issue may be involved.
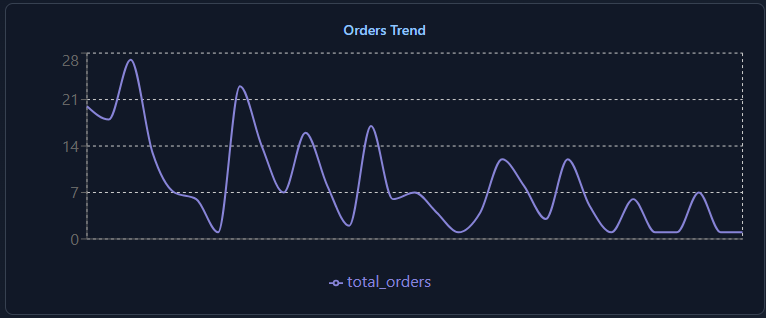
Orders Trend Line Chart
How to read
Read left to right across the selected date range and watch for spikes, dips, and repeated patterns in total order volume.
What it is intending to show
This chart is meant to show order volume over time without other variables layered in, making it easier to spot demand patterns first.
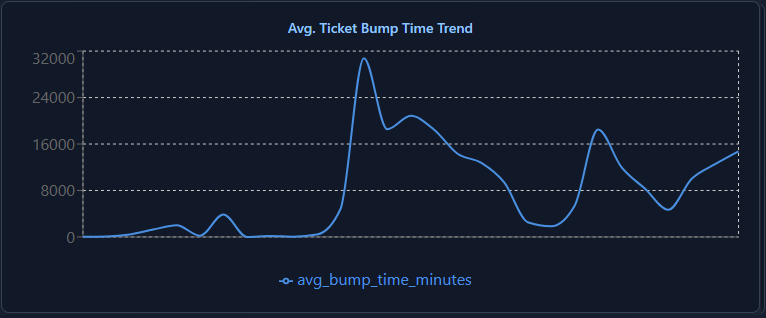
Avg. Ticket Bump Time Trend Line Chart
How to read
Follow the line over time and note where bump times climb, fall, or stay stable. Compare those changes against known service periods or operational events.
What it is intending to show
This chart is meant to isolate kitchen speed so managers can see whether execution is improving, slipping, or becoming inconsistent.
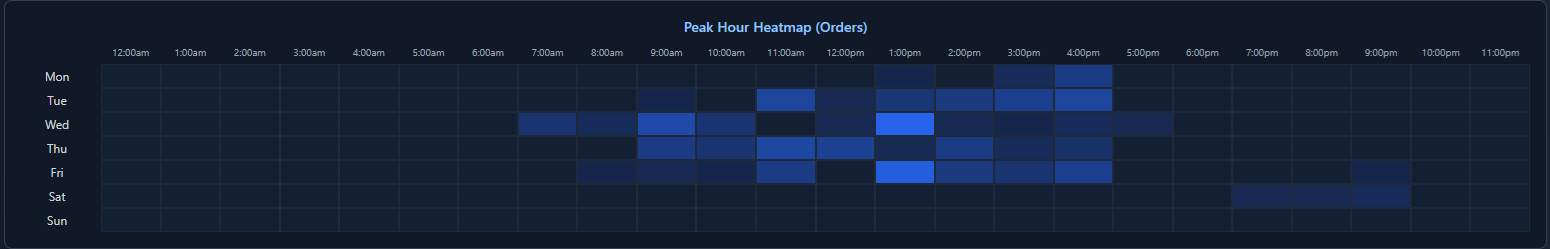
Peak Hour Orders Heatmap
How to read
Read across the hours and down the days of the week. Darker or stronger cells indicate heavier order concentration during that day and hour.
What it is intending to show
This chart is meant to show when the club is busiest so staffing, prep, and operational planning can line up with real demand windows.
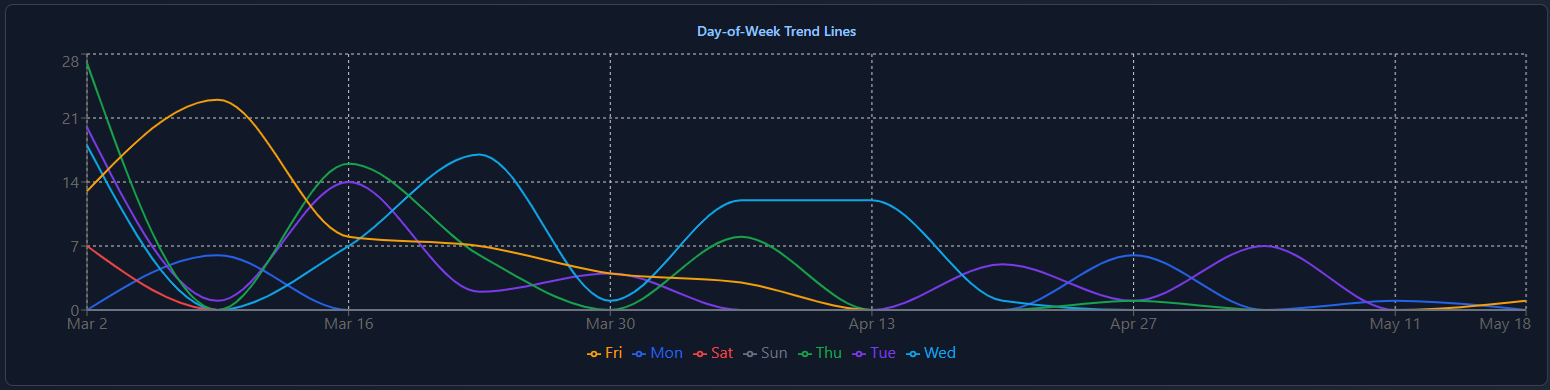
Day-of-Week Trend Line Chart
How to read
Compare each colored day-of-week line across the timeline to see how Monday behaves versus Tuesday, Wednesday, and the rest.
What it is intending to show
This chart is meant to show repeatable weekly patterns so managers can tell whether certain days consistently outperform or behave differently from others.
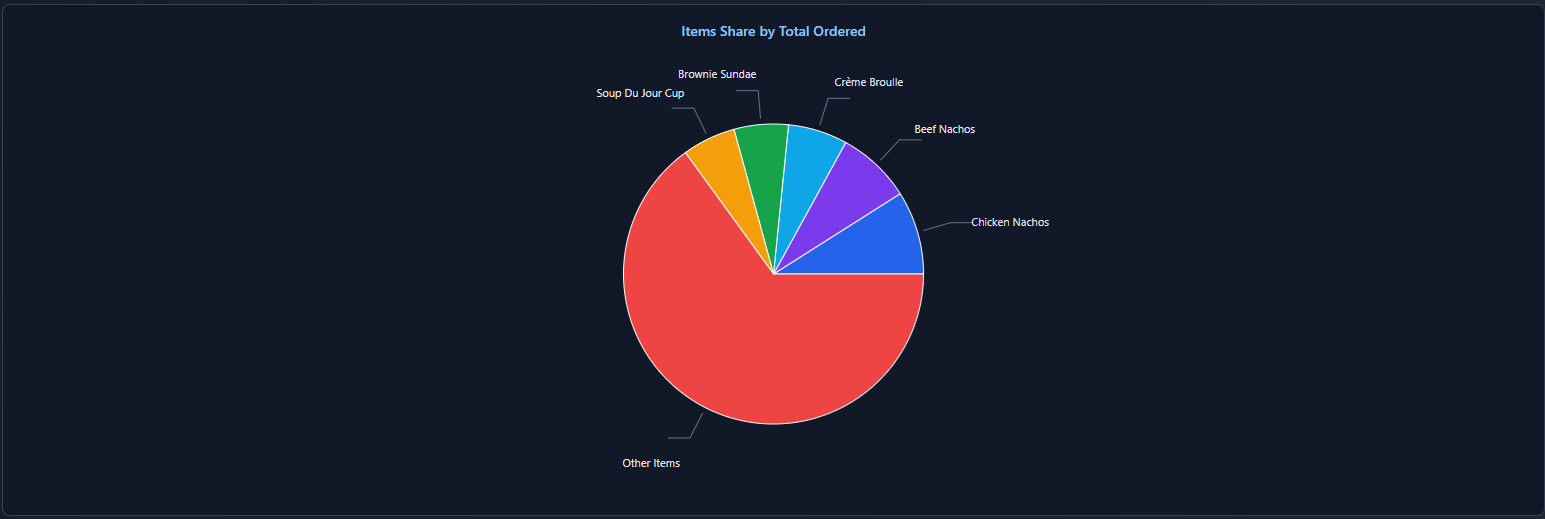
Items Share by Total Ordered Pie Chart
How to read
Read each slice as a share of the total item volume in the selected reporting window. Larger slices represent items or groups that make up more of the total ordered mix.
What it is intending to show
This chart is meant to show item mix at a glance so managers can quickly see which items dominate the overall order volume during the selected period.
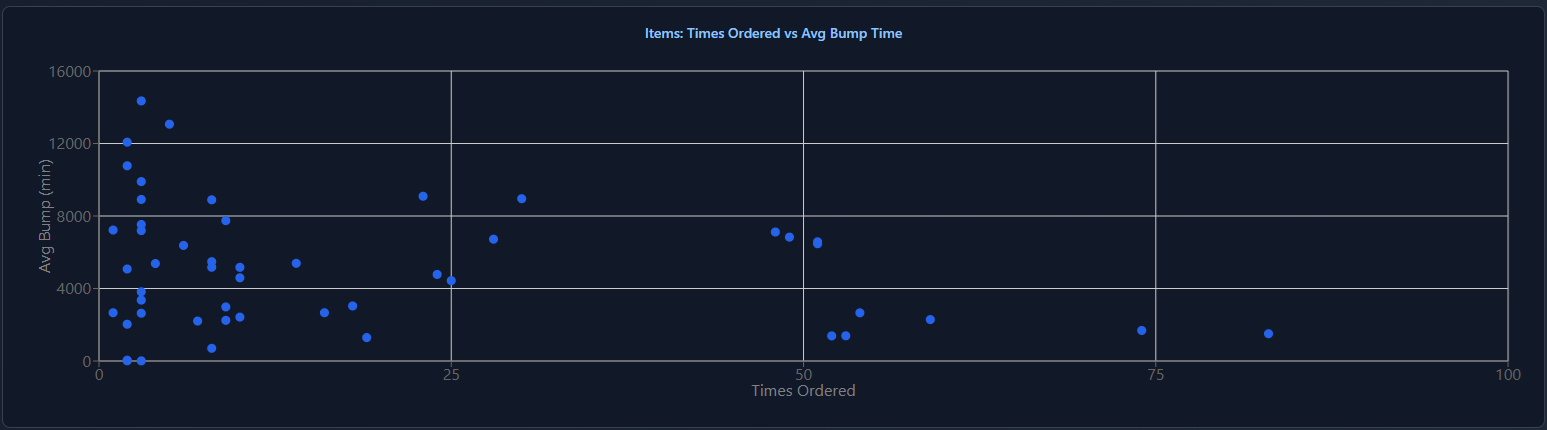
Items: Times Ordered vs Avg Bump Time Scatter Plot
How to read
Each dot represents an item. Read left to right for how often it was ordered and bottom to top for its average bump time. Dots farther right were ordered more often, and dots higher up were associated with slower bump performance.
What it is intending to show
This chart is meant to help managers spot whether certain frequently ordered items may also be tied to slower kitchen execution, which can help guide prep, routing, or menu review conversations.
Orders
Order-focused detail and ticket analysis.
The Orders tab is all about orders. This is where managers move from high-level trend review into the actual order activity behind the numbers.
What It Is Good For
Reviewing order volume by day, by server, by table, and by individual ticket.
Manager Intent
Use this when you are trying to understand who drove the volume, which tables generated the most orders, or what happened during a particular meal period.
Pro Tip
Compare Orders by Day with Orders by Server and Orders by Table when a service feels unusually chaotic.
Orders Reports And Charts You Can Use
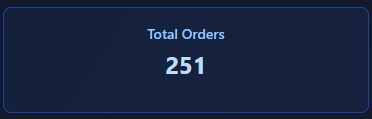
Total Orders Summary Card
How to read
Read this as the total number of orders in the selected reporting window after all current filters have been applied.
What it is intending to show
This card is meant to give you the fastest possible volume snapshot for the selected scope.
Avg. Items per Order Summary Card
How to read
Read this as the average number of items attached to each order during the selected reporting window.
What it is intending to show
This card is meant to show average order complexity, not just raw volume.

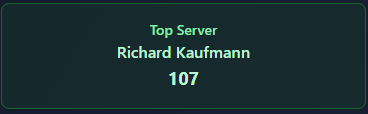
Top Server Summary Card
How to read
This card shows which server generated the highest order count in the current filters, along with the total orders attributed to that person.
What it is intending to show
This card is meant to highlight who drove the most order activity during the selected period.
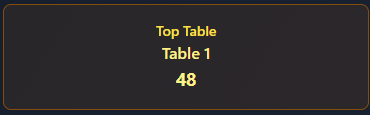
Top Table Summary Card
How to read
This card shows the table with the highest number of orders in the selected reporting range.
What it is intending to show
This card is meant to surface which table generated the highest order activity, which can be useful when reviewing dining room flow or event-style service.
Top Orders Day Summary Card
How to read
This card shows the highest single order-volume day in the selected reporting window, along with the total number of orders on that day.
What it is intending to show
This card is meant to quickly identify the heaviest day in the selected period.

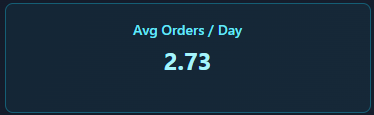
Avg Orders / Day Summary Card
How to read
Read this as the average number of orders per day across the selected range.
What it is intending to show
This card is meant to smooth out daily highs and lows so managers can understand typical demand.
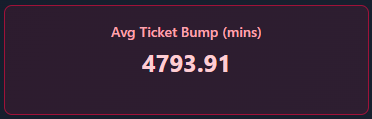
Avg Ticket Bump (mins) Summary Card
How to read
Read this as the average bump time for tickets in the selected reporting window.
What it is intending to show
This card is meant to show the average service speed outcome across the current filters.
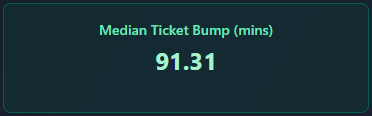
Median Ticket Bump (mins) Summary Card
How to read
Read this as the midpoint bump time, which can be more stable than the average when outlier tickets exist.
What it is intending to show
This card is meant to give a cleaner picture of typical ticket speed when a few unusually long or short tickets might distort the average.
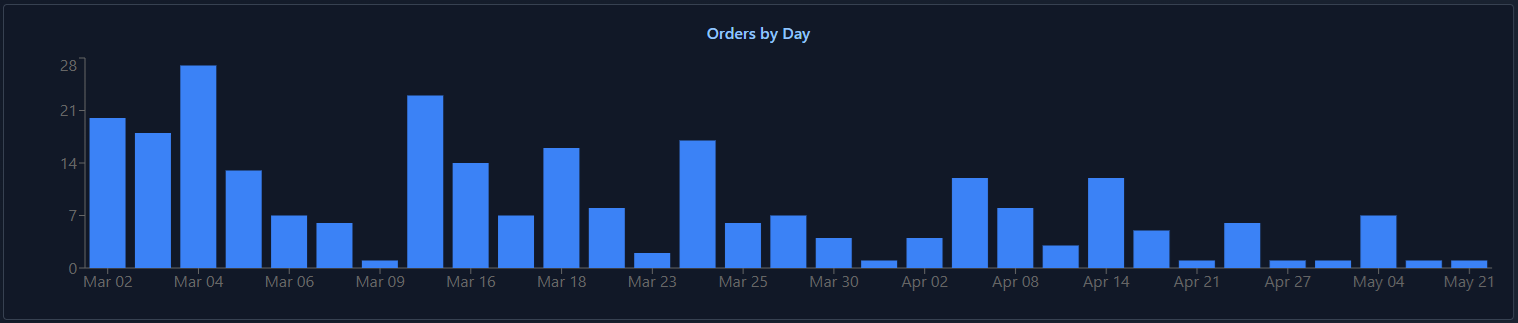
Orders by Day Bar Chart
How to read
Read left to right across the dates. Taller bars represent higher order counts on those days.
What it is intending to show
This chart is meant to show daily order volume so managers can spot spikes, dips, and unusual service days.
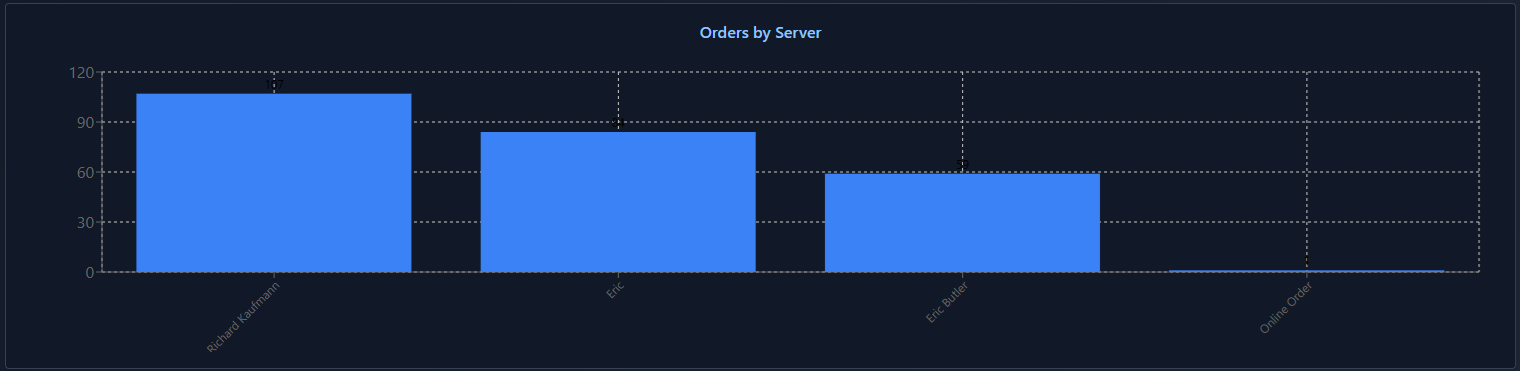
Orders by Server Bar Chart
How to read
Compare bar heights across servers. Taller bars mean more orders associated with that person.
What it is intending to show
This chart is meant to show who is generating the most order volume during the selected period.
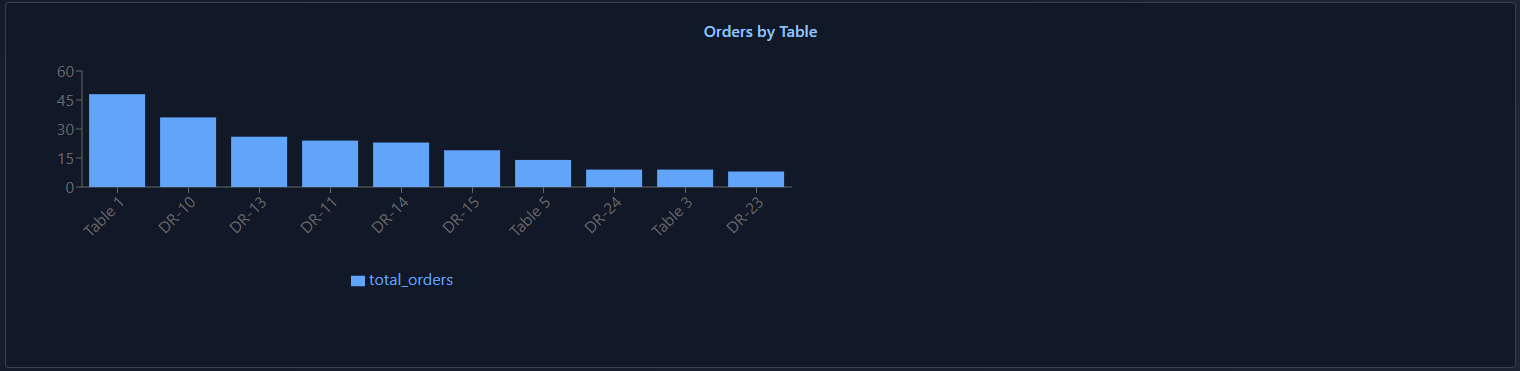
Orders by Table Bar Chart
How to read
Compare the table bars to see which tables produced the highest number of orders in the reporting range.
What it is intending to show
This chart is meant to help managers see where order activity is concentrating in the dining room.
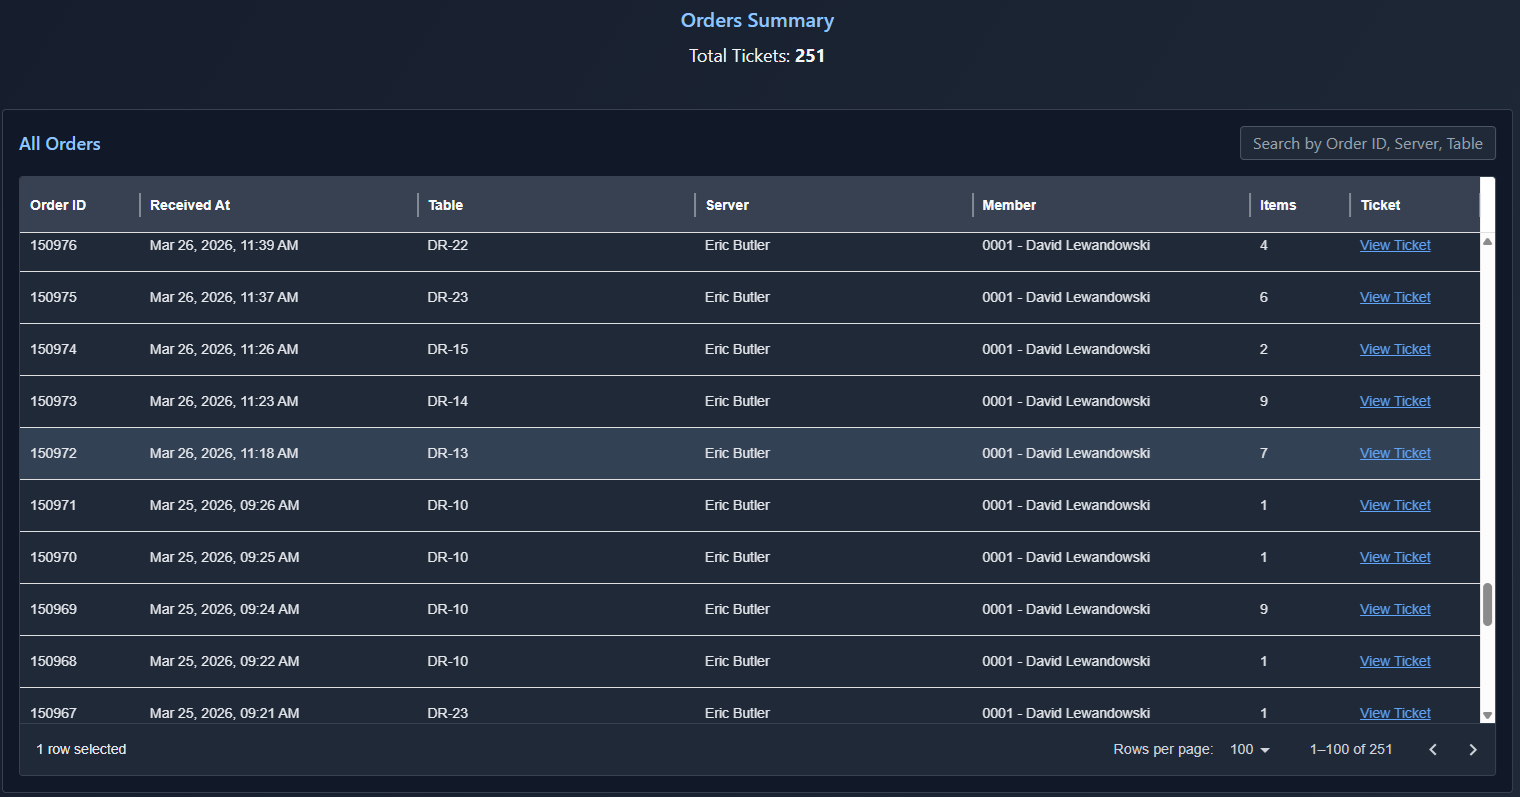
Orders Summary and Ticket Drill-Down
This section is more than a single chart. It is a working order summary area where managers can search, browse, select tickets, and drill into ticket detail by station and by course.
Orders Summary and All Orders Table
This image shows the searchable order list. Managers can use the search bar or scroll through the table to find a specific order, review columns like order ID, received time, table, server, member, and item count, then select View Ticket to open the drill-down view.
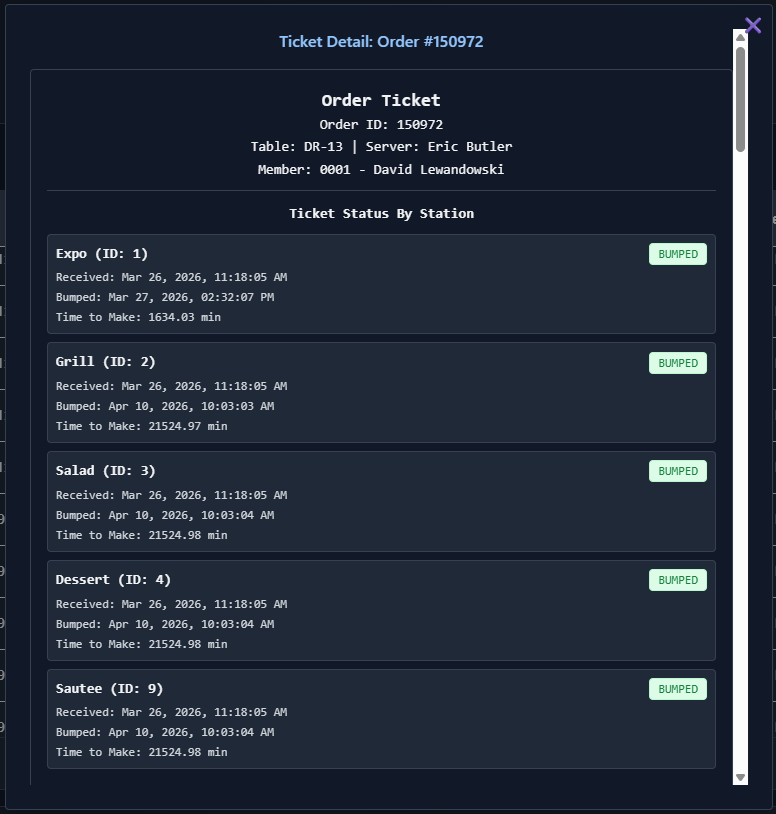
This image shows what appears right after selecting View Ticket. Here managers can see when each station received and bumped the overall ticket, which helps track how the order moved across the kitchen.
This image shows the deeper course and item breakdown. Managers can drill down to see when each station bumped the course and then look even further to see when each station bumped the individual items inside that course.
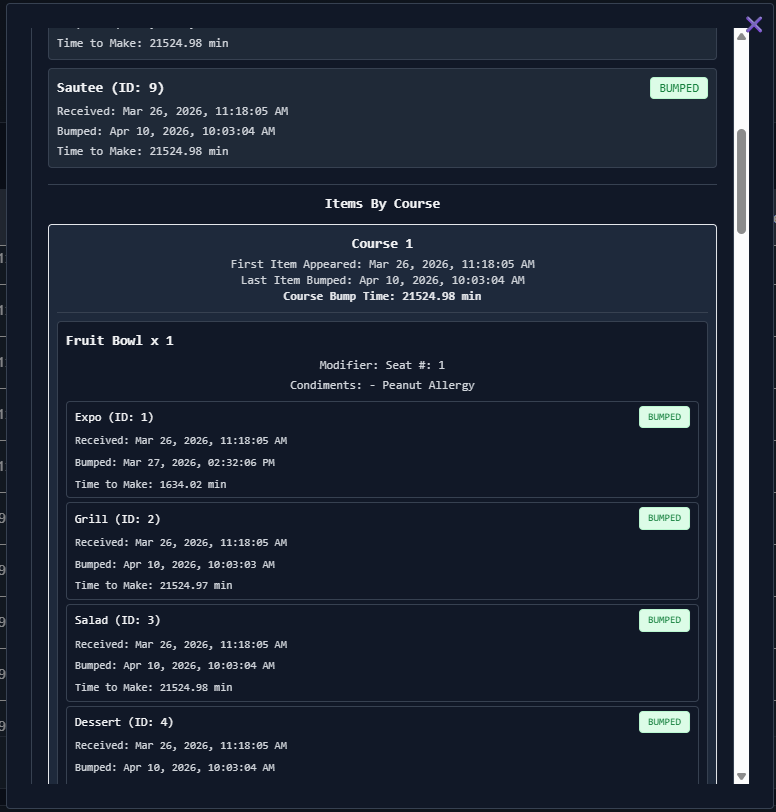
Pro tip
This is one of the most useful screens when troubleshooting complaints, timing questions, or confusion about where a ticket slowed down. It lets you move from summary reporting into exact operational detail at the station, course, and item level.
Items
Item mix, popularity, and item-level performance.
The Items tab is all about items. It helps managers understand what menu items are being ordered, how often they are showing up, and how item mix may relate to kitchen performance.
Items Reports And Charts You Can Use
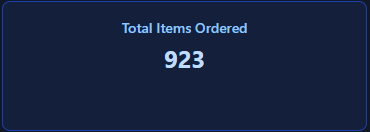
Total Items Ordered Summary Card
How to read
This card shows the total number of items sold during the selected filter range. It is a simple volume number and reflects item count, not ticket count.
What it is intending to show
This gives managers a quick sense of overall menu movement. It is useful when comparing how much actual item production took place across outlets, date ranges, or stations.
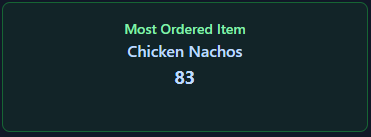
Most Ordered Item Summary Card
How to read
This card names the single most ordered item in the selected report view and shows how many times it appeared.
What it is intending to show
This helps managers spot the current top seller quickly. It is useful for understanding what is driving volume and what items may deserve extra prep attention or operational focus.
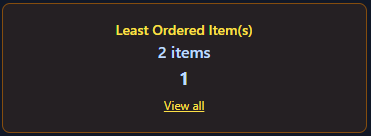
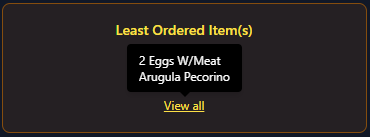
Least Ordered Item(s) Summary Card
How to read
This card shows the least ordered item in the selected range. If there is a tie, the card will show that multiple items are tied, and managers can hover over View all to see the tied item names.
What it is intending to show
This helps identify low-moving items that may need menu review, pricing review, better promotion, or a conversation about whether they are still worth carrying.
The first image shows the tied-card state. The second image shows the hover behavior over View all when there are multiple least ordered items.
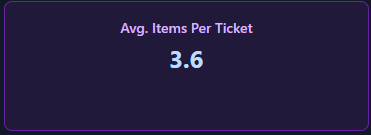
Average Items Per Ticket Summary Card
How to read
This card shows the average number of items attached to each order during the selected period.
What it is intending to show
This gives a quick read on ticket complexity. A higher number can mean heavier production load even if total order count stays flat.
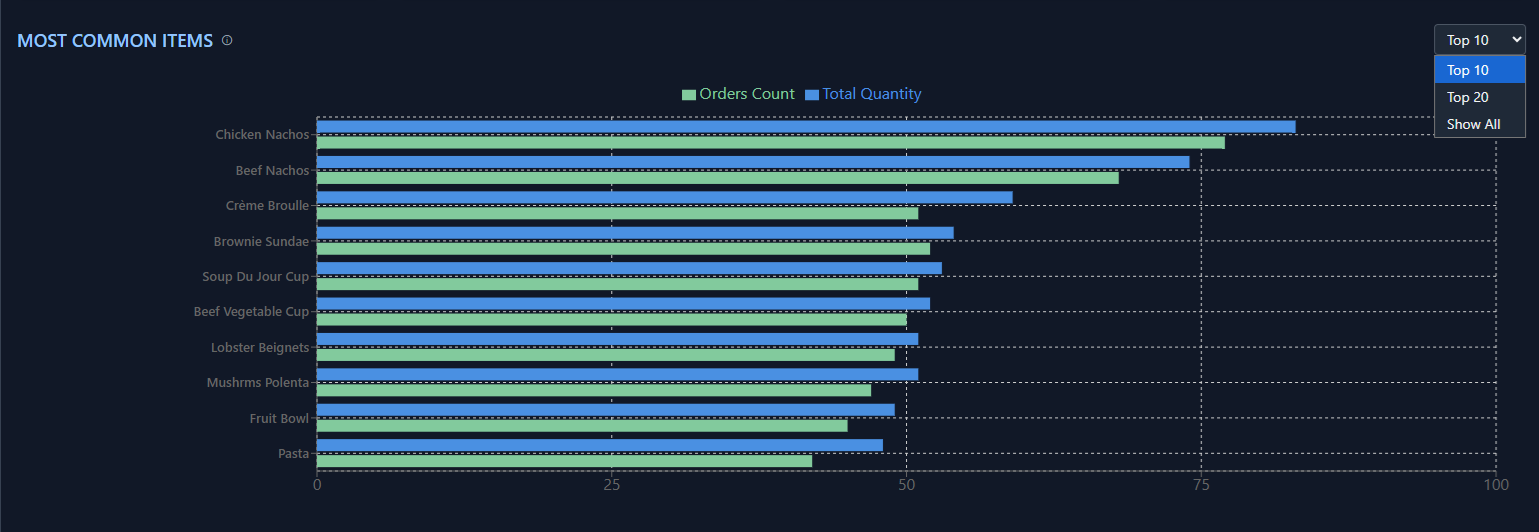
Most Common Items Bar Chart
How to read
This chart ranks the most common items in the selected view. It compares Orders Count and Total Quantity, and the selector in the top-right lets managers switch between shorter lists like Top 10 or broader views like Show All.
What it is intending to show
This helps managers see which menu items truly drive demand. It is useful for prep planning, menu engineering conversations, and understanding whether a few items dominate production.
Items Detail Table
How to read
This table lists items with their Total Quantity, Orders Count, and Avg. Bump Time. It is one of the easiest places to compare item popularity against average item timing in a sortable, reviewable format.
What it is intending to show
This gives managers a practical working list for spotting patterns. It can highlight items that sell often and move well, items that are popular but slow, or low-volume items that may still create outsized kitchen drag.
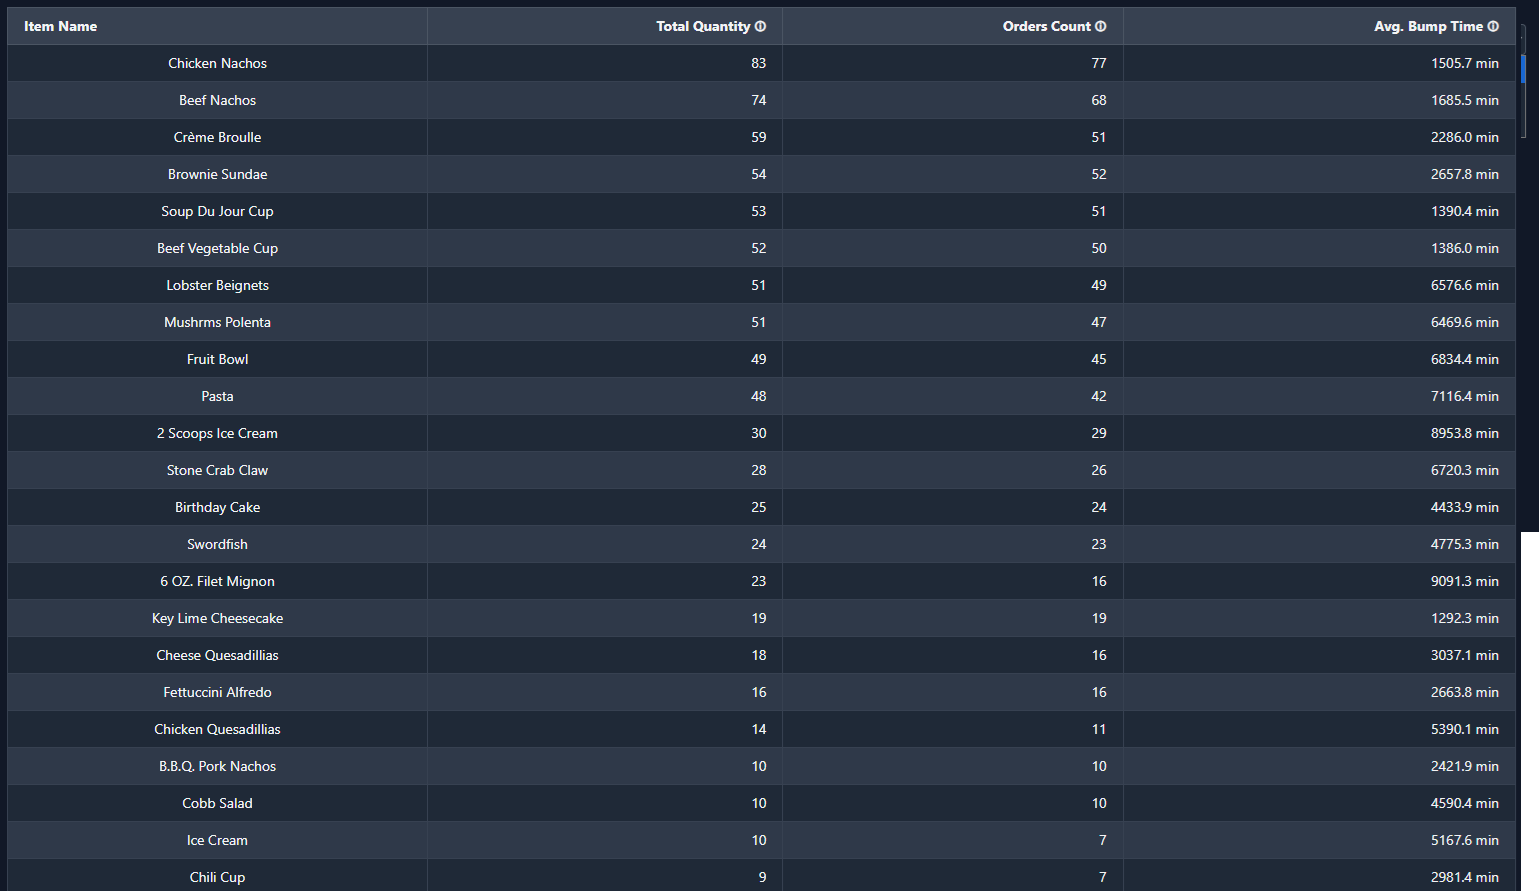
Pro tip
When you see an item with strong volume and a high average bump time, that is a good place to look for prep changes, station support needs, or menu execution opportunities. This table is especially useful when menu conversations need to be grounded in actual operational data.
Good First Questions To Ask
Which sublocation has the highest volume during the selected period?
Do bump-time spikes line up with peak order windows?
Which servers, tables, or outlets create the most operational load?
Which items are most common, and do they appear during slower service periods?
Pro Tips
A few practical notes that make manager-side setup, reporting, and daily use smoother.
Tip 1
Some settings are easier to change from a computer
A few settings are more convenient to manage from a desktop or laptop, especially anything that involves browsing for files or uploading assets.
Sound settings are the best example. If you need to upload custom sounds, doing that from a computer is usually faster and easier than trying to handle it directly on the KDS screen.
Tip 2
Refresh after changing settings
After changing settings, refresh the screen so the new settings fully activate.
This is especially helpful when you are testing display behavior, sounds, coursing changes, or station workflow settings and want to be sure you are looking at the current configuration.
Tip 3
Use reports to support menu conversations
The reporting area is most useful when it helps answer real operational questions. Use item mix, bump time, and order trends to support conversations about prep load, service pace, and menu performance with actual data instead of gut feel alone.
Need the full reference?
Open the Settings Manual for line-by-line detail
The dedicated Settings Manual breaks down every tab and setting with its title, explanation, where to find it, and default value.
Open Settings ManualCommon Questions
Quick answers to things that come up on the line.
Quick Reference
| I want to... | How to do it |
|---|---|
| Mark one item complete | Double tap the item line on the card to give it a strikethrough |
| Mark an order complete | Double tap header section of a ticket or press the green BUMP button on the ticket card |
| Fire the next course | Press Fire on the bottom bar, then Course, and then select the course you'd like to fire. |
| Hold a ticket temporarily | Select the park icon. Use Unpark in the footer to get it back. |
| Print a ticket | Select the printer icon on the ticket card |
| Change sound alerts | Settings gear, then Sound Notifications tab |
| Switch dark or light mode | Settings gear, then Appearance tab |
| See all active orders | Navigate to the Queue Screen |
| Switch to another station | Go back to Screen Selection and pick a different card |
| Log out | Logout button in the top-right corner of any screen |
Need More Help?
Contact the TTA team directly for support, demos, or product information.
Sales
sales@tta.club
Request a demo, quote, or product information.
Help
help@tta.club
Get help with the Ticket Board Service.
Phone: +1-800-474-2582